Day traders have always worked with speed, but crypto adds another layer of pressure. Prices move all day, liquidity changes quickly, and a token can look calm on a chart while wallet activity is already shifting elsewhere. For anyone trading around short windows, that delay matters.
AI trading tools now help traders read more than price. They bring blockchain activity, token charts, liquidity changes and wallet flows into a cleaner routine, so the trader is not stuck moving between several screens while the market is already changing.
Why day traders need more than price charts
A price chart shows what already reached the market. It does not always show why the move started, whether it has support, or whether the activity comes from a small cluster of wallets. That missing context matters when a trader is deciding if a move deserves attention or if it is only noise.
For day traders who check price, liquidity, wallet movement and DEX activity before acting, crypto trading works better when live blockchain data sits beside the chart, not in a separate research tab. That setup helps traders compare price action with what is happening inside the market before they make a decision.
This does not make trading safer by itself. It gives the trader more evidence to review. A token rising while liquidity holds steady and more wallets take part looks different from a token pushed up while pool depth thins.
How AI trading tools help spot useful patterns
Raw blockchain data can get messy fast. One active token might have thousands of transfers, swaps and pool changes behind a single move. A block explorer shows the activity, but it leaves the trader to connect wallet behavior, timing, liquidity and volume by hand.
AI trading tools reduce that manual work by grouping related signals. A trader may want to know why volume rose, whether a few wallets caused most of the action, or whether liquidity changed before the price moved. Instead of starting with scattered tabs, the trader starts with a clearer question and then checks the evidence.
This is where crypto AI trading is easiest to justify as research support. It can flag unusual changes, rank alerts and point attention toward tokens that moved outside their normal pattern. The tool should not make the decision. It should help the trader see which part of the market changed.
Why cross-chain activity changes the trading picture
Crypto activity rarely stays in one place. Liquidity can sit across several networks, wallets can move assets between chains, and decentralized markets can show different levels of activity at the same time. A trader watching only one chain may see the price, but miss the movement that explains it. That gap can affect price discovery, especially when activity is split across several markets.
Cross-chain visibility helps connect those pieces. If liquidity leaves one network while swap activity rises somewhere else, the trader gets a better view of how capital is moving. If a larger wallet starts shifting funds before the exchange chart reacts, that movement may become part of the research process.
Bridge activity, wallet movement, liquidity depth and price behavior all need context. Together, they help traders decide whether a move has support or whether it is too thin to trust. That matters when entering or exiting at the expected level becomes harder because liquidity changes.
Day traders do not need more noise. They need alerts that point to changes worth checking. A useful alert might show a sudden liquidity withdrawal, a volume spike outside the normal range, or a change in wallet concentration around a token. If every small movement becomes an alert, the system slows the trader down instead of helping.
Clear thresholds matter because they support triage. Traders can set alerts around volume, liquidity, wallet movement or risk signals, then review whether those alerts match real market changes. Over time, this review process helps them adjust what the system flags and what it ignores.
Why data quality matters before acting
A neat AI summary is only useful when the data behind it is fresh, clear and traceable. If the signal comes from delayed information, thin liquidity or incomplete wallet data, the trader needs to know that before relying on the output. A confident sentence from a tool should not carry more weight than the source data behind it.
Good dashboards show where a signal came from, when the event happened and which on-chain activity supports the alert. This matters for traders, but it also matters for teams that need records for risk review or compliance work.
What traders should look for in an AI analytics setup
A useful platform should match the way the trader works. Speed matters, but usability matters too. If the user still needs several dashboards to check charts, wallet flows, liquidity pools and alerts, the tool has not reduced much friction.
A stronger setup brings the main research steps closer together. Traders should be able to review token movement, check wallet behavior, compare liquidity changes and read AI-assisted signals without losing the thread. The system should also make it easy to question the signal before accepting it.
For newer traders, this can build better habits around evidence. For experienced traders, it can cut repetitive checking and make pattern review faster. The tool should help the trader see the market more clearly before acting.
Why AI-assisted research is becoming part of the routine
Day trading will keep putting pressure on speed, but faster tools are not enough on their own. Traders still need clean inputs, clear alerts and enough context to separate a meaningful pattern from a short burst of activity.
AI trading and blockchain analytics are becoming part of that routine because they help organize the market while it moves. Its best use is a cleaner research flow, where traders move from price to wallet activity to liquidity changes, then decide with a clearer view of what changed.


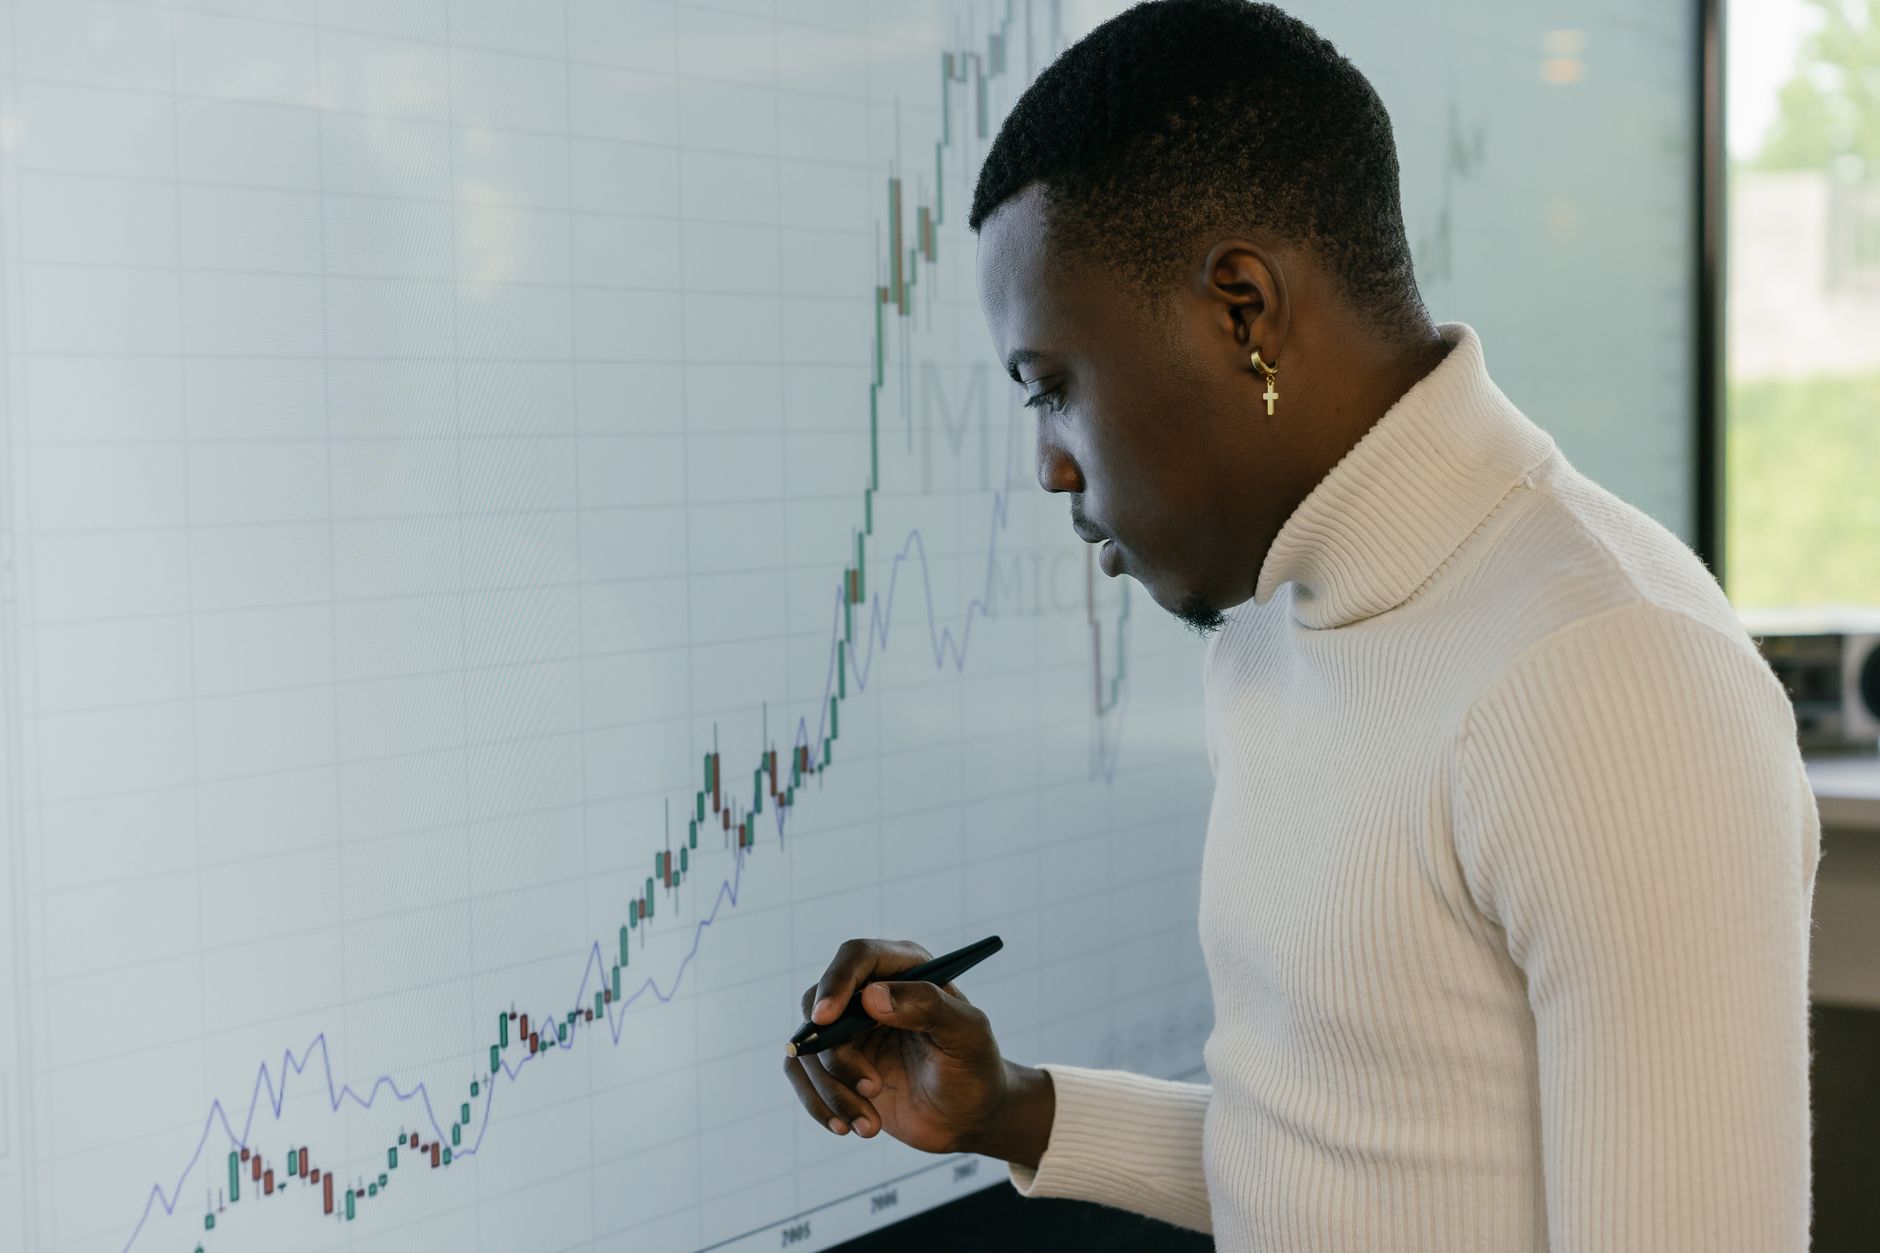
Day traders have always worked with speed, but crypto adds another layer of pressure. Prices move all day, liquidity changes quickly, and a token can look calm on a chart while wallet activity is already shifting elsewhere. For anyone trading around short windows, that delay matters.
AI trading tools now help traders read more than price. They bring blockchain activity, token charts, liquidity changes and wallet flows into a cleaner routine, so the trader is not stuck moving between several screens while the market is already changing.
Why day traders need more than price charts
A price chart shows what already reached the market. It does not always show why the move started, whether it has support, or whether the activity comes from a small cluster of wallets. That missing context matters when a trader is deciding if a move deserves attention or if it is only noise.
For day traders who check price, liquidity, wallet movement and DEX activity before acting, crypto trading works better when live blockchain data sits beside the chart, not in a separate research tab. That setup helps traders compare price action with what is happening inside the market before they make a decision.
This does not make trading safer by itself. It gives the trader more evidence to review. A token rising while liquidity holds steady and more wallets take part looks different from a token pushed up while pool depth thins.
How AI trading tools help spot useful patterns
Raw blockchain data can get messy fast. One active token might have thousands of transfers, swaps and pool changes behind a single move. A block explorer shows the activity, but it leaves the trader to connect wallet behavior, timing, liquidity and volume by hand.
AI trading tools reduce that manual work by grouping related signals. A trader may want to know why volume rose, whether a few wallets caused most of the action, or whether liquidity changed before the price moved. Instead of starting with scattered tabs, the trader starts with a clearer question and then checks the evidence.
This is where crypto AI trading is easiest to justify as research support. It can flag unusual changes, rank alerts and point attention toward tokens that moved outside their normal pattern. The tool should not make the decision. It should help the trader see which part of the market changed.
Why cross-chain activity changes the trading picture
Crypto activity rarely stays in one place. Liquidity can sit across several networks, wallets can move assets between chains, and decentralized markets can show different levels of activity at the same time. A trader watching only one chain may see the price, but miss the movement that explains it. That gap can affect price discovery, especially when activity is split across several markets.
Cross-chain visibility helps connect those pieces. If liquidity leaves one network while swap activity rises somewhere else, the trader gets a better view of how capital is moving. If a larger wallet starts shifting funds before the exchange chart reacts, that movement may become part of the research process.
Bridge activity, wallet movement, liquidity depth and price behavior all need context. Together, they help traders decide whether a move has support or whether it is too thin to trust. That matters when entering or exiting at the expected level becomes harder because liquidity changes.
How live alerts fit into a trading routine
Day traders do not need more noise. They need alerts that point to changes worth checking. A useful alert might show a sudden liquidity withdrawal, a volume spike outside the normal range, or a change in wallet concentration around a token. If every small movement becomes an alert, the system slows the trader down instead of helping.
Clear thresholds matter because they support triage. Traders can set alerts around volume, liquidity, wallet movement or risk signals, then review whether those alerts match real market changes. Over time, this review process helps them adjust what the system flags and what it ignores.
Why data quality matters before acting
A neat AI summary is only useful when the data behind it is fresh, clear and traceable. If the signal comes from delayed information, thin liquidity or incomplete wallet data, the trader needs to know that before relying on the output. A confident sentence from a tool should not carry more weight than the source data behind it.
Good dashboards show where a signal came from, when the event happened and which on-chain activity supports the alert. This matters for traders, but it also matters for teams that need records for risk review or compliance work.
What traders should look for in an AI analytics setup
A useful platform should match the way the trader works. Speed matters, but usability matters too. If the user still needs several dashboards to check charts, wallet flows, liquidity pools and alerts, the tool has not reduced much friction.
A stronger setup brings the main research steps closer together. Traders should be able to review token movement, check wallet behavior, compare liquidity changes and read AI-assisted signals without losing the thread. The system should also make it easy to question the signal before accepting it.
For newer traders, this can build better habits around evidence. For experienced traders, it can cut repetitive checking and make pattern review faster. The tool should help the trader see the market more clearly before acting.
Why AI-assisted research is becoming part of the routine
Day trading will keep putting pressure on speed, but faster tools are not enough on their own. Traders still need clean inputs, clear alerts and enough context to separate a meaningful pattern from a short burst of activity.
AI trading and blockchain analytics are becoming part of that routine because they help organize the market while it moves. Its best use is a cleaner research flow, where traders move from price to wallet activity to liquidity changes, then decide with a clearer view of what changed.
Share this:
Like this: